Easyclus© is based on years of experience with handling large amounts of flow cytometric monitoring data. A lot of research, further improvement and development of new algorithms have been acquired to process multivariate flow cytometric datasets automatically and efficiently. To accelerate and improve the use of flowcytometry, robust and objective data analysis software is required. See also the EasyClus.com website.
Easyclus© can handle data of a lot of cytometric instruments and is especially optimized for phytoplankton data of CytoSense flowcytometers (CytoBuoy bv).
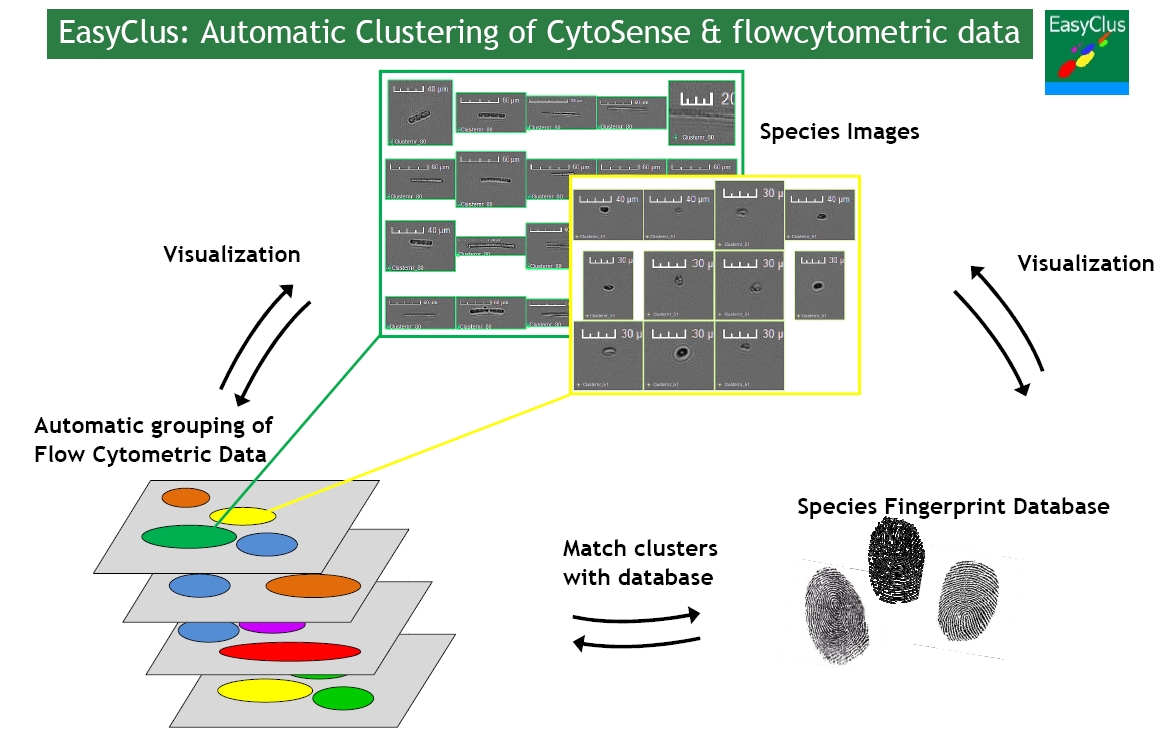
Figure 1: Each particle is characterized by signal profiles, like a finger print. EasyClus groups these fingerprints belonging to specific algae types. Results can be validated by images. Groups of similar fingerprints are stored in a database. Cell sizes, biovolumes, cell concentrations, biomass, chlorophyll and biodiversity indicators are extracted from the cytometric data by EasyClus.
GPS synchronization by EasyClus of online flowcytometry data and Ferrybox data equipped with fluorescence sensors.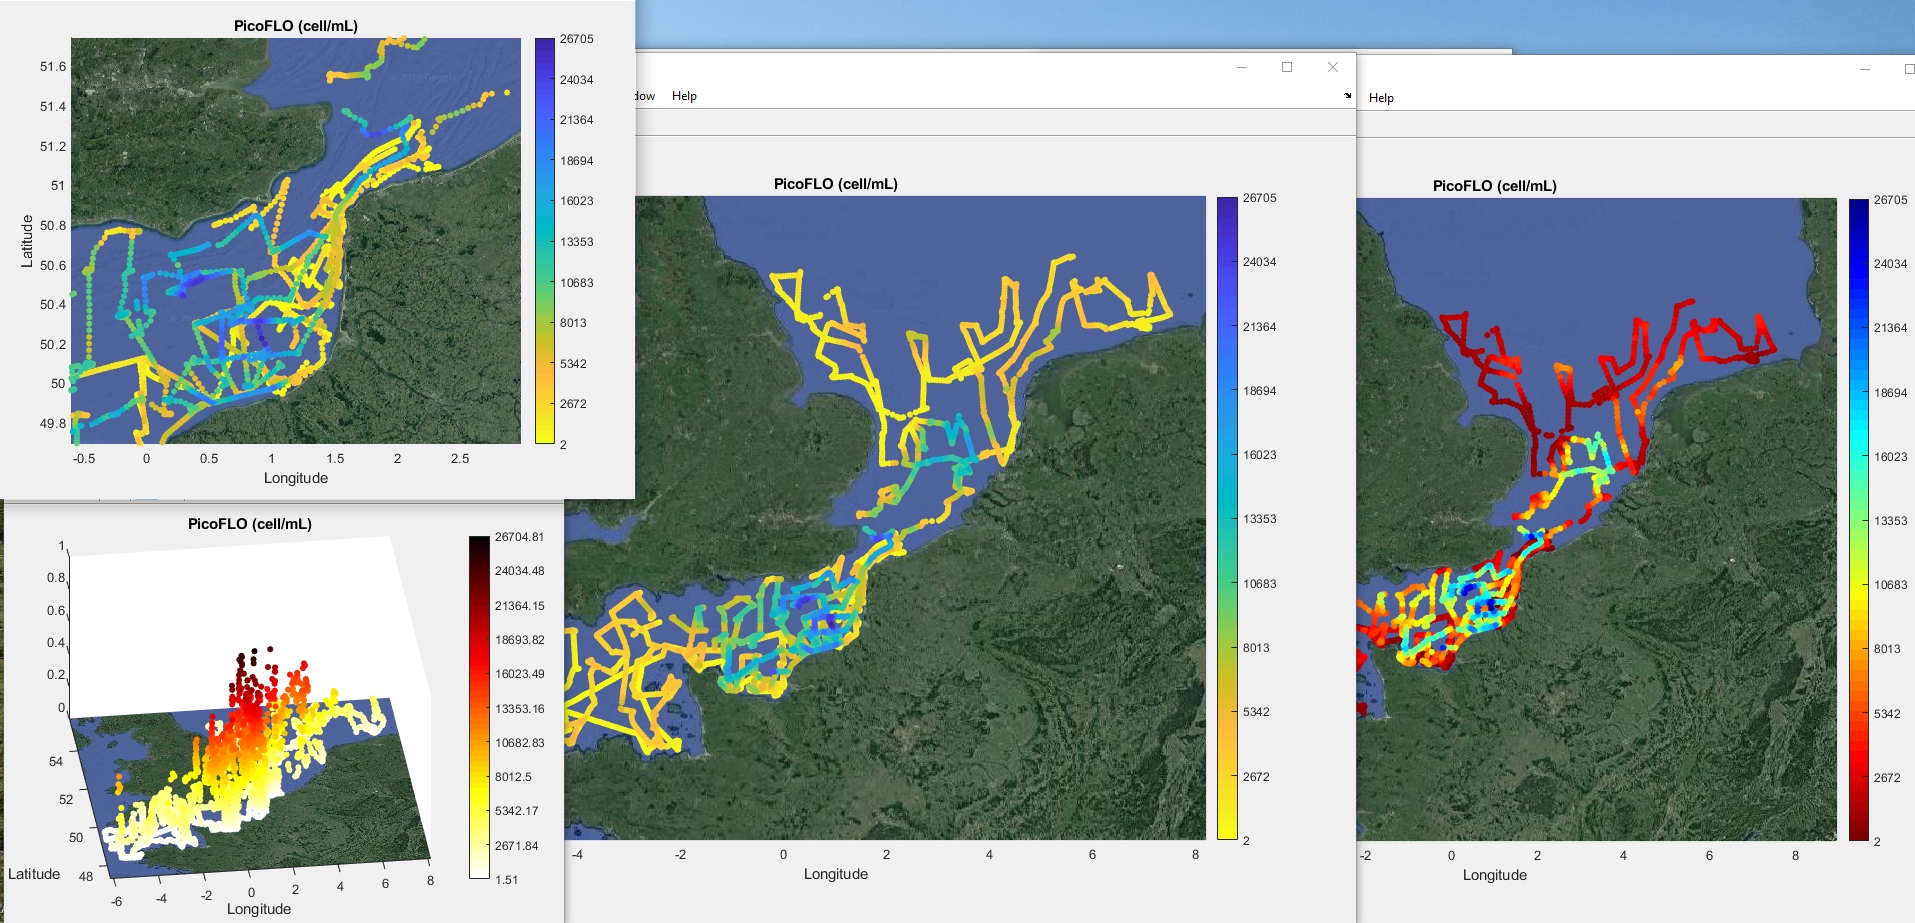
Figure 2: The sum of chlorophyll fluorescence of each particle (FCM) correlates strongly with the total chlorophyll concentration analyzed by traditional techniques. Interpolation between data points is easily performed by EasyClus. High frequent online analysis is one of the advantages of flow cytometry. Direct analysis of fresh biological samples without transportation and changes within the samples, is another important advantage.
Easyclus LIVE© is the online flowcytometric analyses e.g. near a river, on a ship or on a platform in a lake combined with realtime data processing and reportage to the internet. Results and the instrument status can be watched on an internet website (also by smartphone) just a few seconds after analysis.

Figure 3: Upper left: bars represent the contribution of several size algae fractions in water (count/ml, chlorophyll/ml). Automatic clustering of species groups is done resulting in scatter plots with different groups of algae. Right upper : Cyanobacteria vs other algae. Left below : Groups of pico-nano-micro plankton, Cryptophytes, Cyanobacteria and some other functional type groups, Right below : Suspended matter in water
Results of the phytoplankton monitoring can also be observed easily by smartphone without high download sizes, because the files are kept extremely small.
Building your own library
Building your own library is very simple. Each sample contains e.g. 1000 images. Just put these images (jpg-files) into the right speciesnames-folders (swipe) and press update library in EasyClus and you have a library. adding more images to the library follows the same procedure. This library or dataset is used as a training set will immediately enable classification of species in your sample. This classification is just done on a usual computer within minutes. The library should contain 50-100 images for each species (depends on biological variation). Classification will improve by filling the library with more and more species. It is really simple (see also video). The library uses flowcytometric information for the classification in the background. In principle, a beta tool for image analysis data is already available and works according to the same principles.
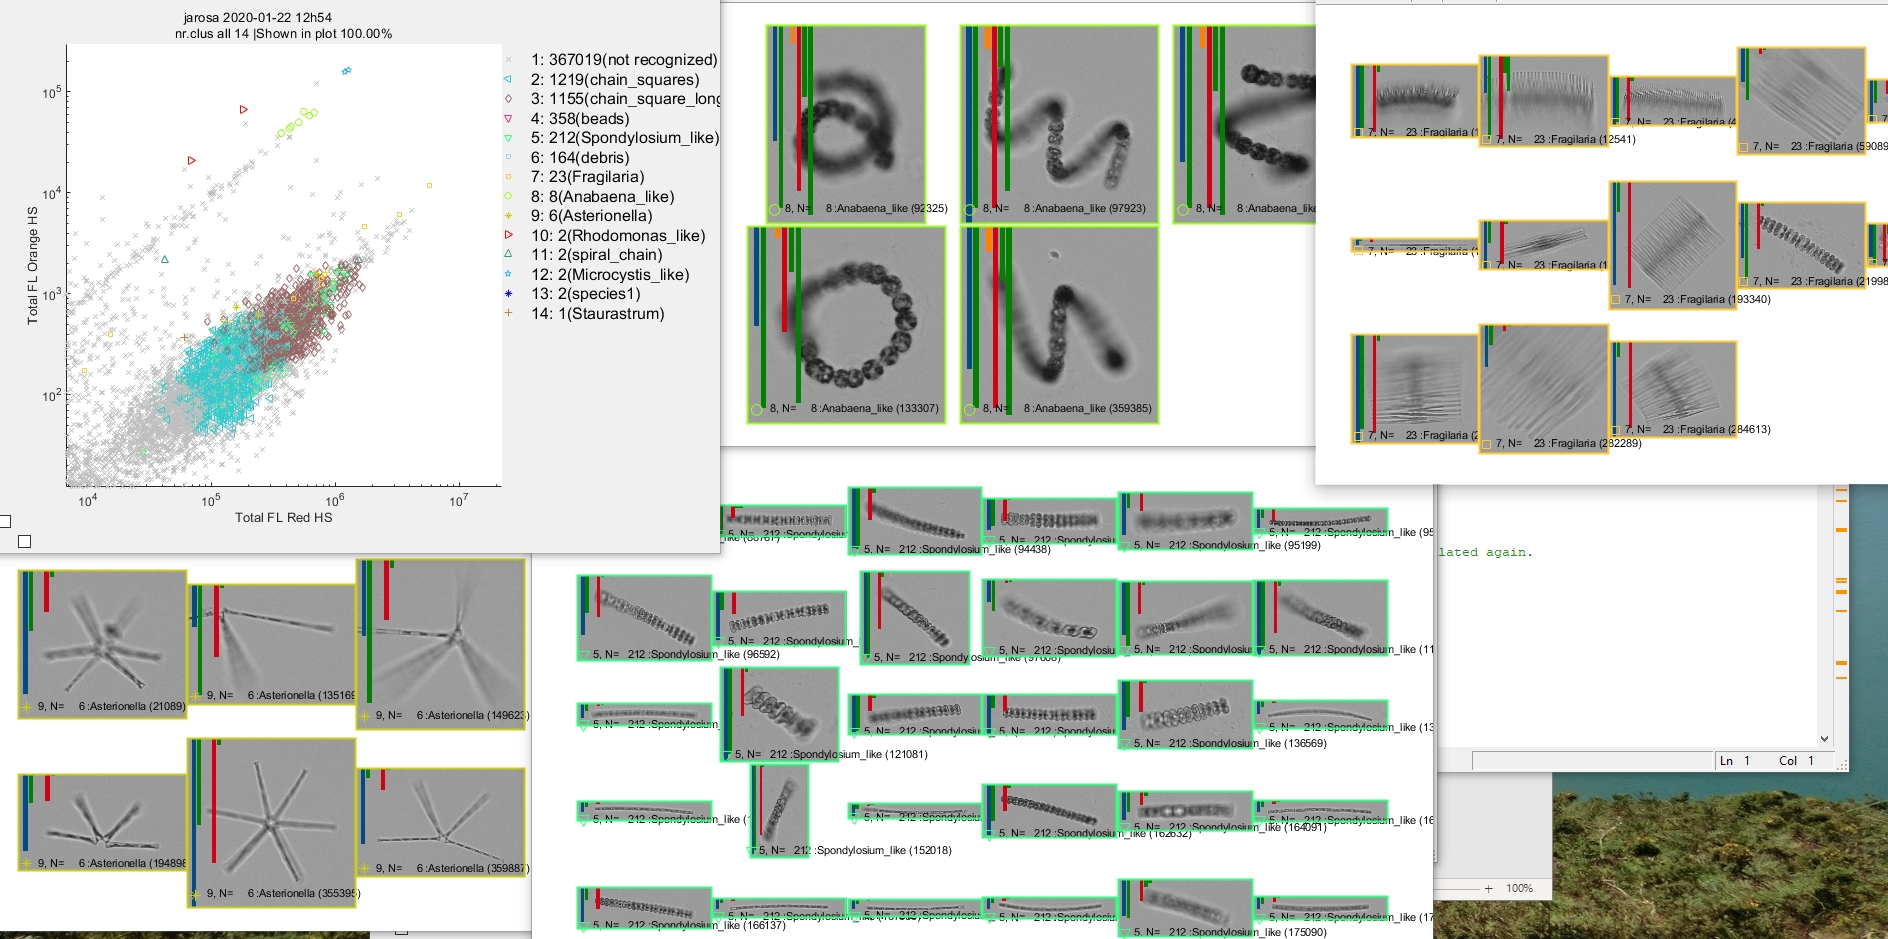
Figure 4: Example of using a library
A small part of the images of a sample of figure 5, have been added to an empty library and this is used for classification. The result below show images found in the clusters and their images. Extra detail should be added to the library for some clusters to improve the classification.

Figure 5: Example of using a small library
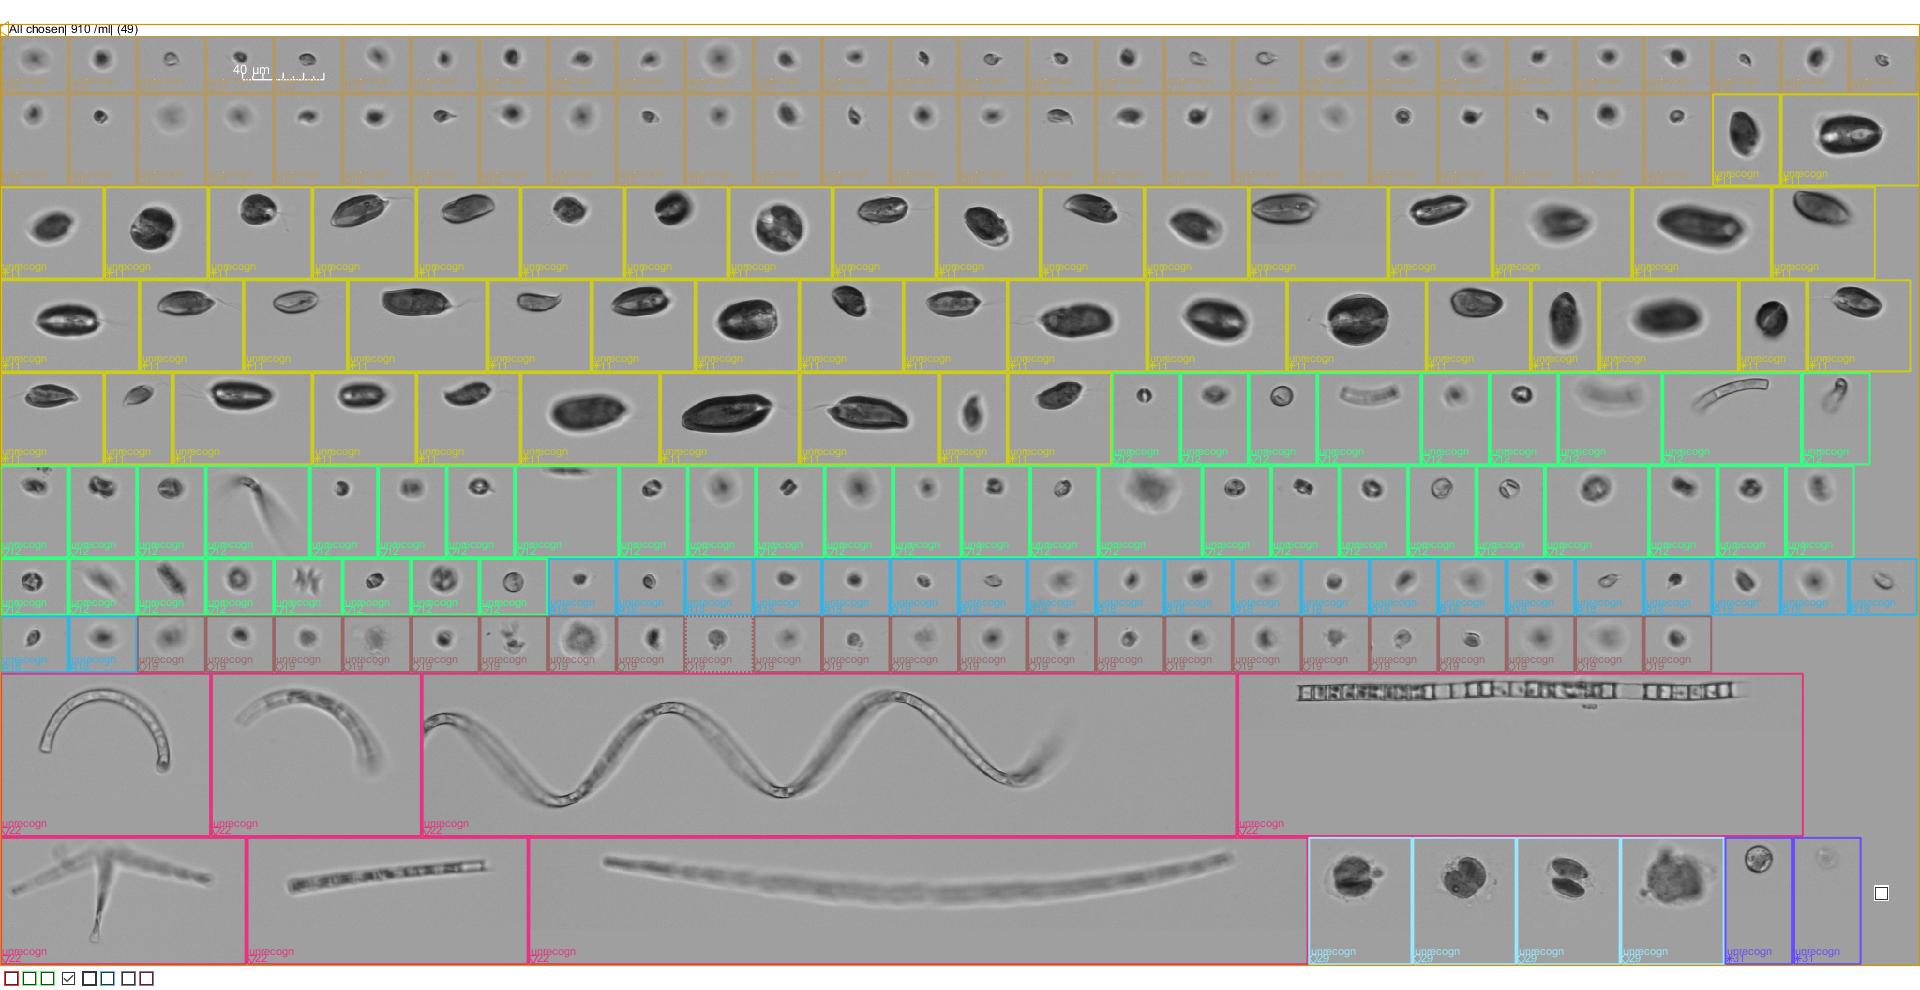

Figure 6 : An example of images and their flowcytometric information, which is not there ONLY using image analysis, projected over each image. This figure shows the unique power of the CytoSense, the combination of images and spectral particle information.
Actual results can be found on www.phytoplanktonlive.com
More EasyClus information is given in this brochure: